Cleaning
Strong data cleaning skills, identifying/addressing errors, inconsistencies, and missing values. Excellent at transforming raw data into clean, structured datasets for insightful analysis. R-programming, SQL, Excel etc.
I am Nincy Alisa Jacob, a highly skilled Data Analyst with a Distinction in MSc Data Science from Kingston University. Proficient in Excel, Tableau, Alteryx, and Power BI, my experience at Hewlett Packard Enterprise and Cue Learn Private Limited has honed my abilities in data transformation, migration, and insightful decision-making.
I am currently seeking new opportunities to apply my skills and expertise in a dynamic and challenging environment. Let's connect!

Strong data cleaning skills, identifying/addressing errors, inconsistencies, and missing values. Excellent at transforming raw data into clean, structured datasets for insightful analysis. R-programming, SQL, Excel etc.
Strong data processing skills, adept at efficiently handling and transforming data using various tools and techniques for effective analysis and decision-making. R-programming, SQL Excel, Tableau etc.

Strong data analysis skills, utilizing diverse techniques and tools to extract valuable insights, make informed decisions, and drive meaningful outcomes from complex datasets. Regression analyses, R-programming, Excel, SQL, Tableau etc.

Excellent skills in data visualization and communication, utilizing visual techniques and tools to effectively present complex data, making it accessible and impactful for diverse audiences. R-programming, Excel, Tableau etc.


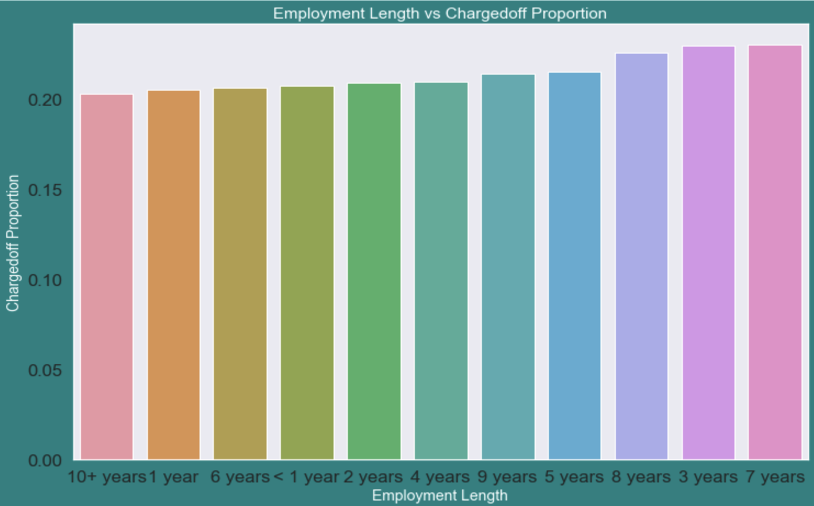
Eploratory data analytics of a large set of HR data on Kaggle.com by Faisal Qureshi to understand correlation and create a prediction model for response variable for 'Employee Satisfaction Level' in relation to given predictors. Statistical analysis was performed through Multiple Linear Regression with R programming in Kaggle Notebooks using R Markup.

Exploratory Data Analysis of a large set of medical appointment data on Kaggle.com by Marwan Diab to understand correlation and create a prediction model for response variables in relation to given predictors. Statistical analysis was performed through logical regression with R programming in Kaggle Notebooks using R Markup.
Retail Data Analysis of a big set of retail sales data based on a number of parameters including holiday events, temperature and CPI. Analysis was performed with SQL in Azure Data Studio 3 notebook and Docker.
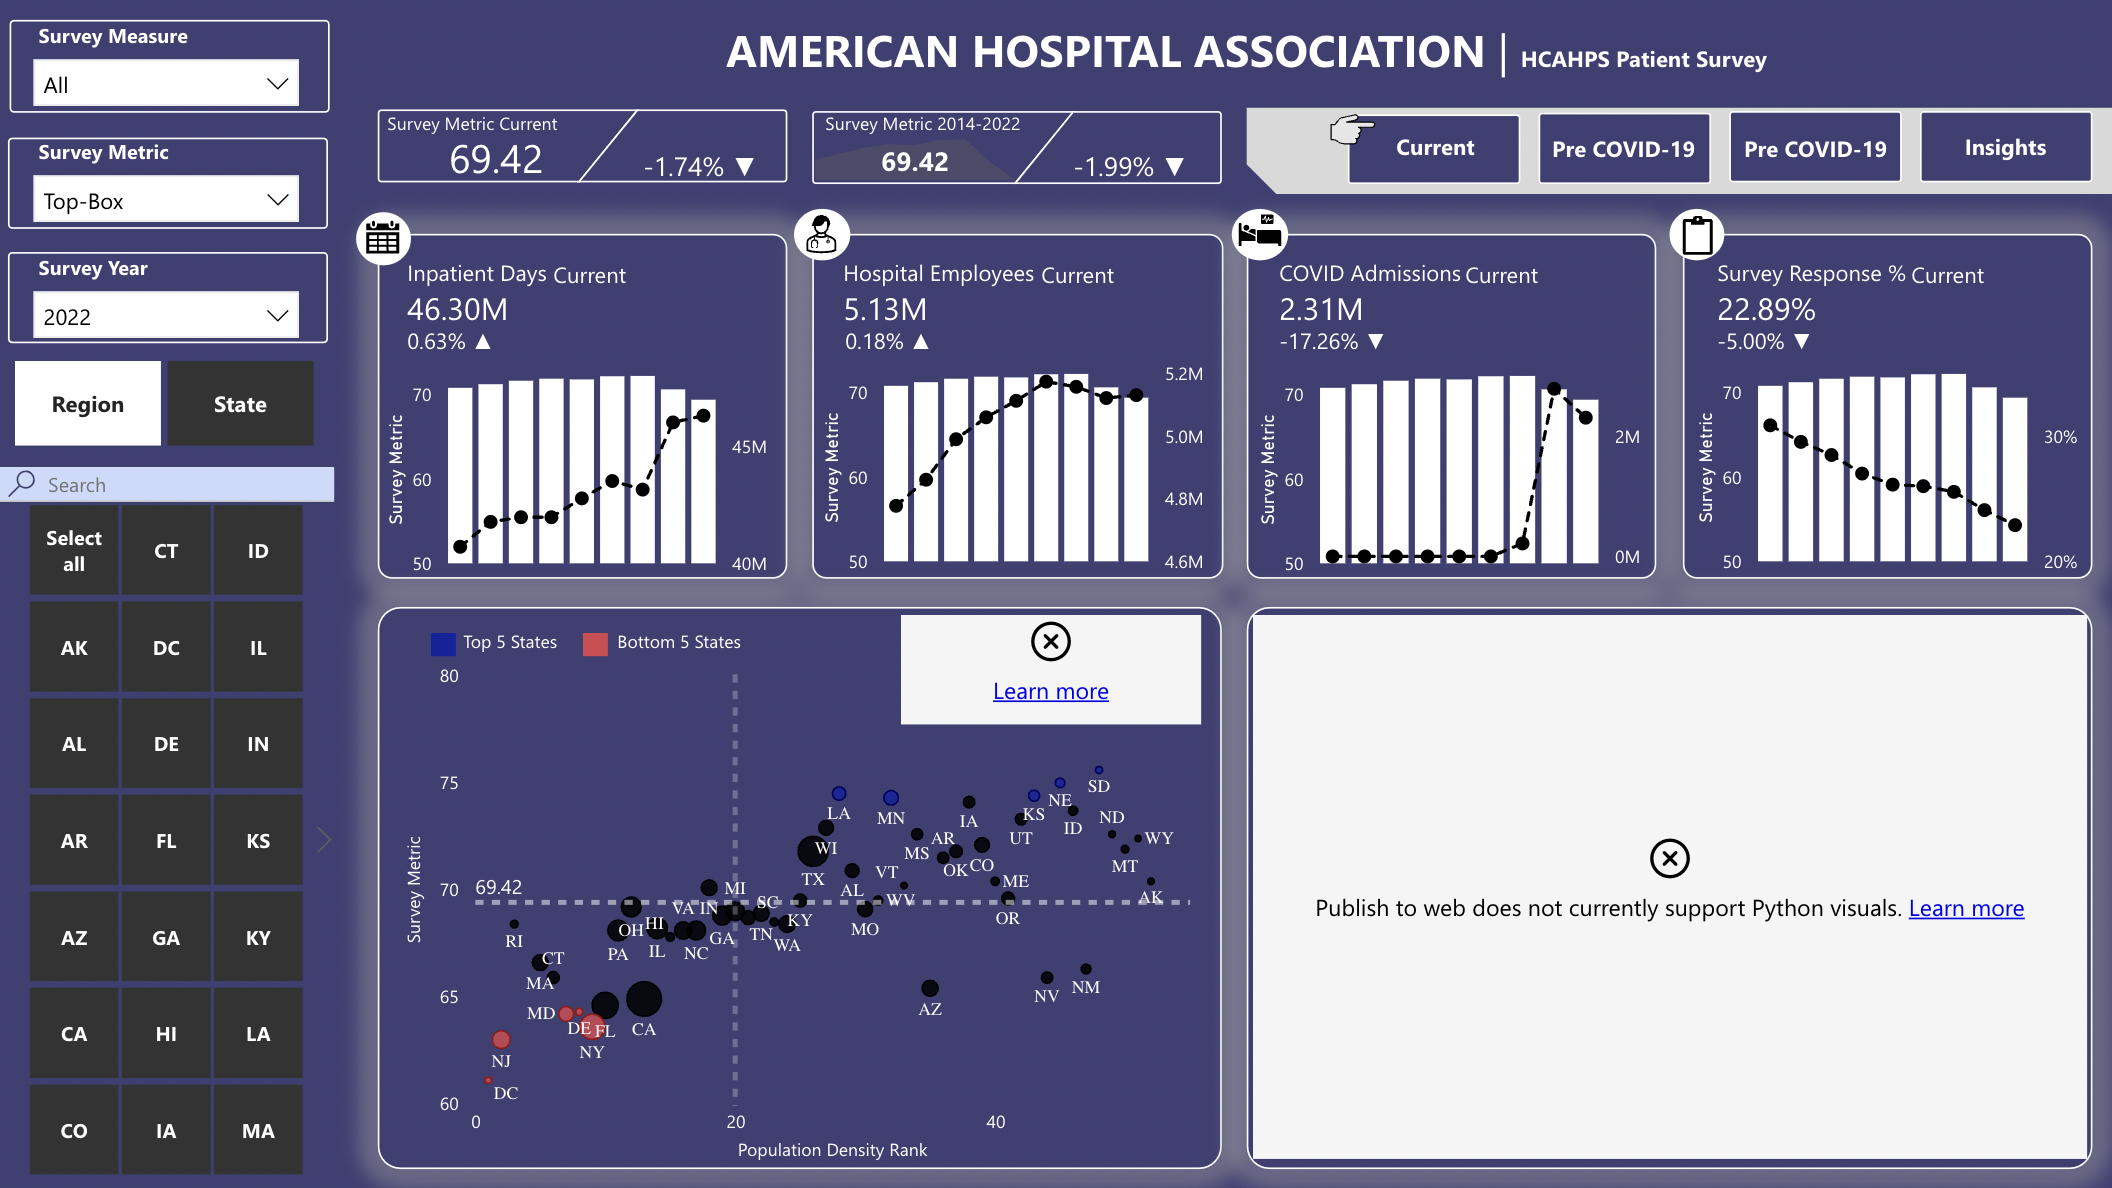
A visualization project on global CO2 emissions data. The analysis was performed visually on Tableau using publicly available dataset.
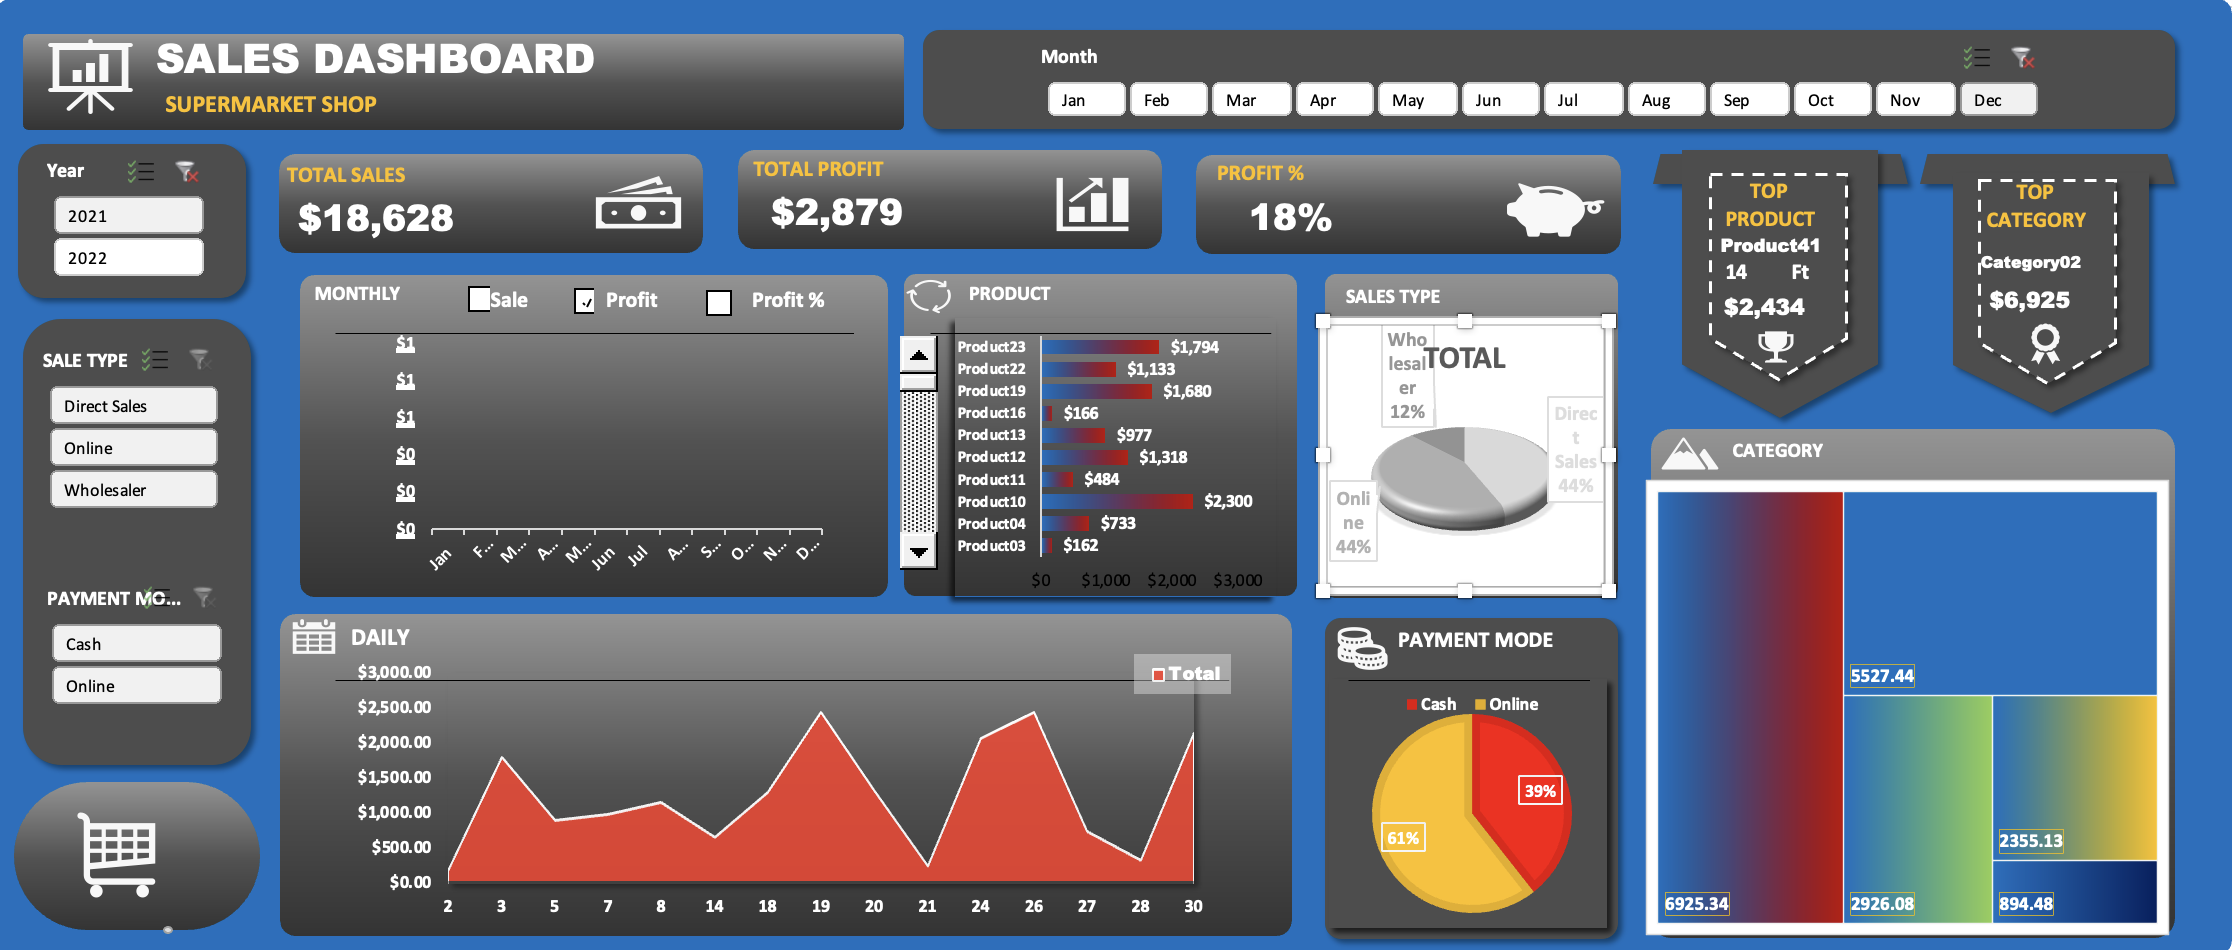
A sales metrics dashboard created in Excel. This project utilizes various Excel features such as XLOOKUP, SUM, AVERAGE, MIN, MAX etc. Analysis is performed using Pivot Tables and visualized with pivot charts in an interactive dashboard.
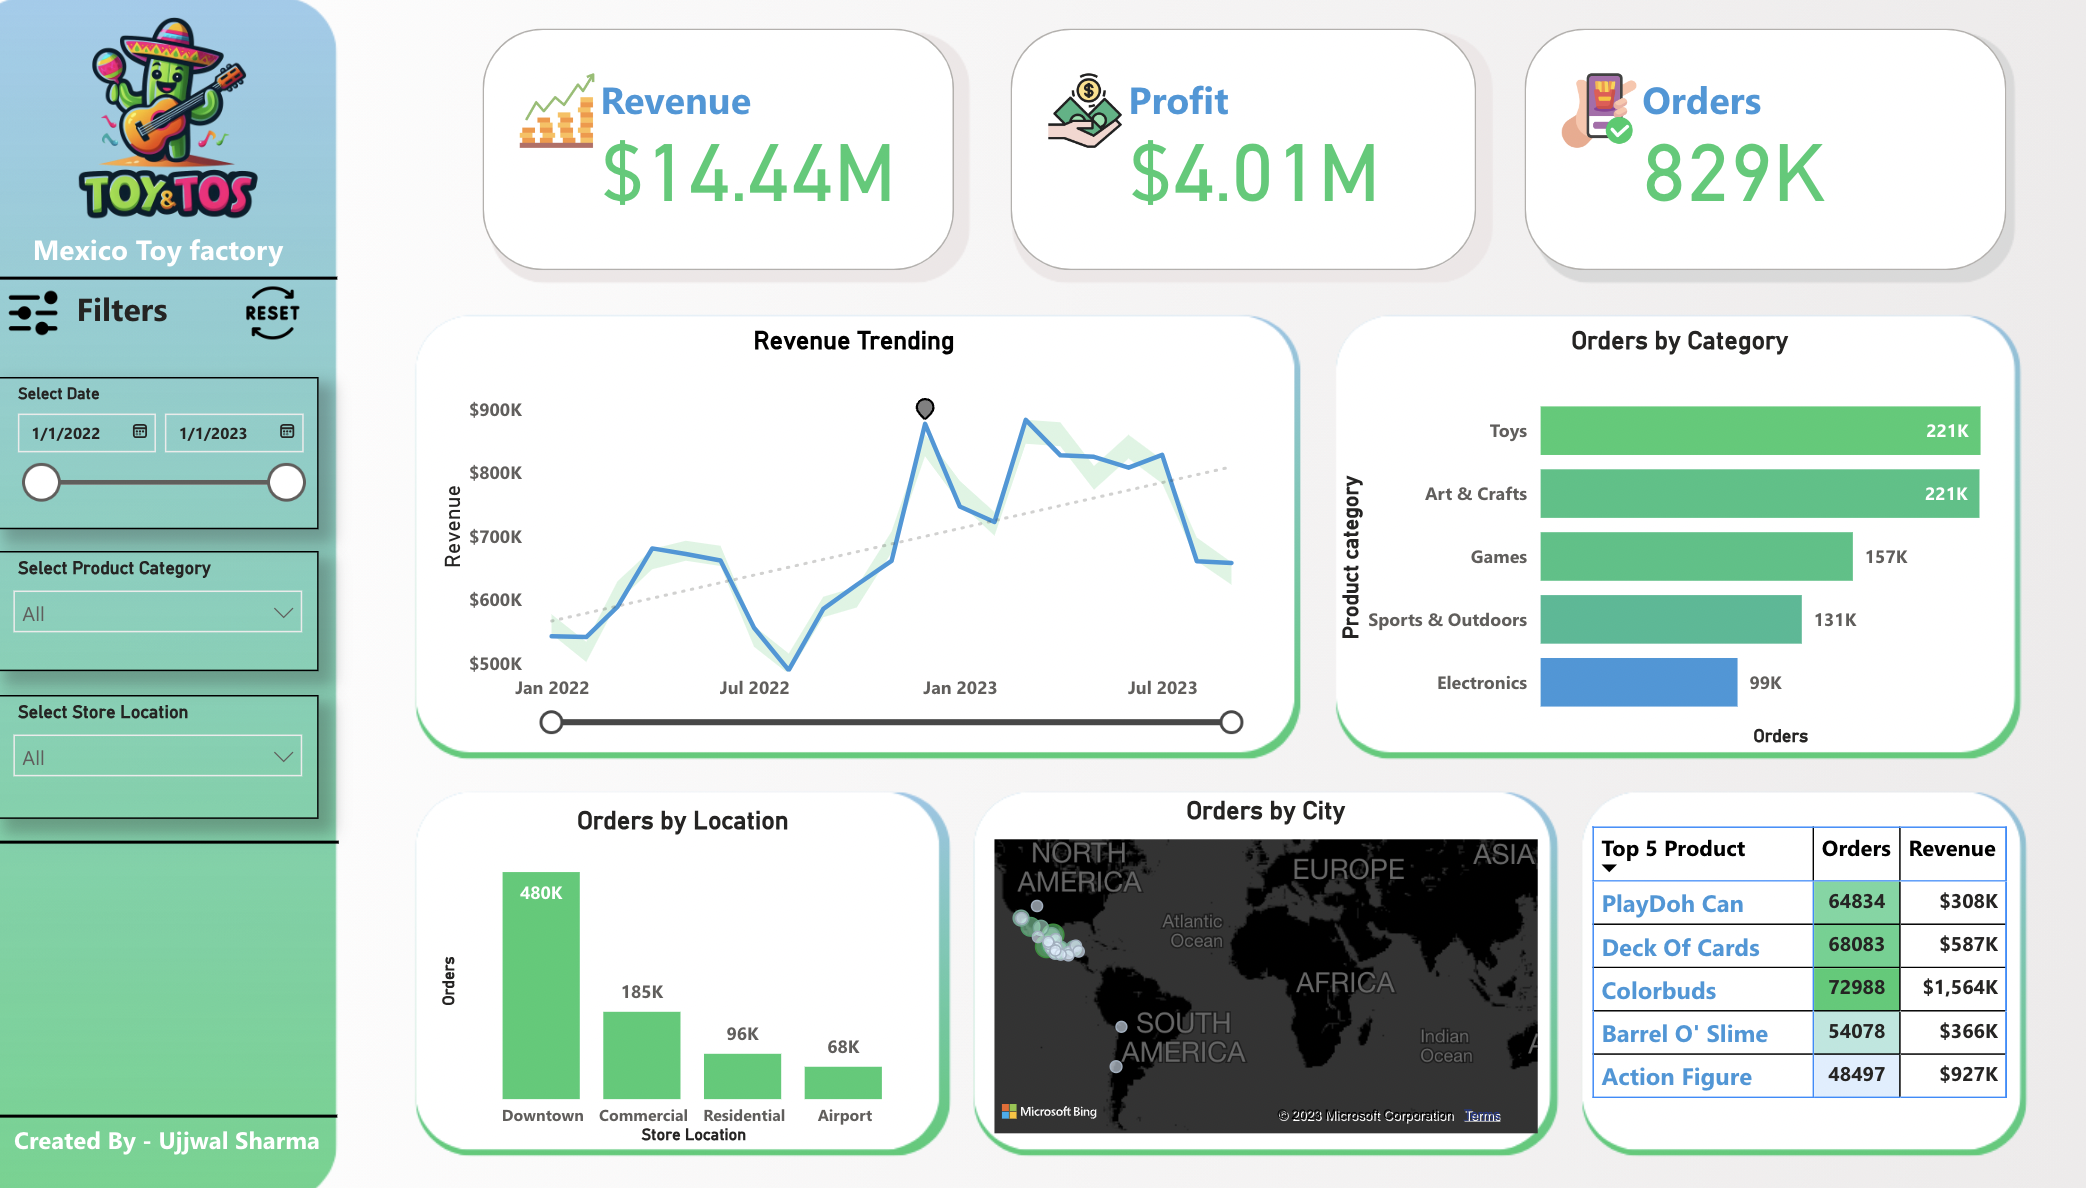
A sales statistics dashboard created in Tableau. This project utilizes Walmart Sales Data of approx. 6400+ rows of sales data from Kaggle.com by Rutu Patel. The data cleaning and analysis was performed with SQL using Azure Data Studio 3 and Docker on MacOS. This is the statistical portion of the data viz on this dataset.